I spent last week at a two-part meeting on language in developmental and acquired disorders, hosted by the Royal Society. The organizers (Dorothy Bishop, Kate Nation, and Karalyn Patterson) devised a meeting structure that stimulated – and made room for – a lot of discussion and one of the major discussion topics throughout the meeting was computational modeling. A major highlight for me was David Plaut’s aphorism “Models are experiments”. The idea is that models are sometimes taken to be the theory, but they are better thought of as experiments designed to test the theory. In other words, just as a theory predicts some behavioral phenomena, it also predicts that a model implementation of that theory should exhibit those phenomena. This point of view has several important, and I think useful, consequences.
Monday, June 17, 2013

Wednesday, May 22, 2013
Choosing a journal
For almost every manuscript I've been involved with, my co-authors and I have had to have a discussion about where (to which journal) we should submit it. Typically, this is a somewhat fuzzy discussion about the the fit between the topic of our manuscript and various journals, the impact factor of those journals (even though I'm not fond of impact factors), their editorial boards (I find that the review process is much more constructive and effective when the editor is knowledgeable about the topic and sends the manuscript to knowledgeable reviewers), manuscript guidelines such as word limits, and turn-around times (which can vary from a few weeks to several months).
I've just learned about a very cool online tool, called JANE (Journal/Author Name Estimator), that provides recommendations. The recommendations are based on similarity between your title or abstract and articles published in various journals (their algorithm is described in a paper). This similarity score comprises the confidence of the recommendation and the journal recommendations come with an Article Influence score, which is a measure of how often articles in the journal get cited (from eigenfactor.org). I tried it out using the titles and abstracts of some recent (but not yet published) manuscripts and I thought it provided very appropriate recommendations. Not surprisingly, the recommendations were a little better when I provided the abstract instead of the title, but I was impressed with how well it did just based on the title (maybe this means that I write informative titles?). JANE can also be used to find authors who have published on your topic, which could be useful for suggesting reviewers and generally knowing who is working in your area, but I found this search type to be noisier, probably simply due to sample size -- a typical author has many fewer publications than a typical journal. JANE won't answer all your journal and manuscript questions, but I am looking forward to using JANE next time I find myself debating where to submit a manuscript.
I've just learned about a very cool online tool, called JANE (Journal/Author Name Estimator), that provides recommendations. The recommendations are based on similarity between your title or abstract and articles published in various journals (their algorithm is described in a paper). This similarity score comprises the confidence of the recommendation and the journal recommendations come with an Article Influence score, which is a measure of how often articles in the journal get cited (from eigenfactor.org). I tried it out using the titles and abstracts of some recent (but not yet published) manuscripts and I thought it provided very appropriate recommendations. Not surprisingly, the recommendations were a little better when I provided the abstract instead of the title, but I was impressed with how well it did just based on the title (maybe this means that I write informative titles?). JANE can also be used to find authors who have published on your topic, which could be useful for suggesting reviewers and generally knowing who is working in your area, but I found this search type to be noisier, probably simply due to sample size -- a typical author has many fewer publications than a typical journal. JANE won't answer all your journal and manuscript questions, but I am looking forward to using JANE next time I find myself debating where to submit a manuscript.
Thursday, May 16, 2013
A function for comparing groups on a set of variables
I'm often in the position of needing to compare groups of either items or participants on some set of variables. For example, I might want to compare recognition of words that differ on some measure of lexical neighborhood density but are matched on word length, frequency, etc. Similarly, I might want to compare individuals with aphasia that have anterior vs. posterior lesions but are matched on lesion size, aphasia severity, age, etc. I'll also need to report these comparisons in a neat table if/when I write up the results of the study. This means computing and collating a bunch of means, standard deviations, and t-tests. This is not particularly difficult, but it is somewhat laborious (and boring), so I decided to write a function that would do it for me. Details after the jump.
Friday, April 5, 2013
Multiple pairwise comparisons for categorical predictors
Dale Barr (@datacmdr) recently had a nice blog post about coding categorical predictors, which reminded me to share my thoughts about multiple pairwise comparisons for categorical predictors in growth curve analysis. As Dale pointed out in his post, the R default is to treat the reference level of a factor as a baseline and to estimate parameters for each of the remaining levels. This will give pairwise comparisons for each of the other levels with the baseline, but not among those other levels. Here's a simple example using the
ChickWeight data set (part of the datasets package). As a reminder, this data set is from an experiment on the effect of diet on early growth of chicks. There were 50 chicks, each fed one of 4 diets, and their weights were measured up to 12 times over the first 3 weeks after they were born.Thursday, April 4, 2013
R 3.0 released; ggplot2 stat_summary bug fixed!
The new version of R was released yesterday. As I understand it, the numbering change to 3.0 represents the recognition that R had evolved enough to justify a new number rather than the addition of many new features. There are some important new features, but I am not sure they will affect me very much.
For me, the much bigger change occurred in the update of the ggplot2 package to version 0.9.3.1, which actually happened about a month ago, but I somehow missed it. This update is a big deal for me because it fixes a very unfortunate bug from version 0.9.3 that broke one of my favorite features: stat_summary(). As I mentioned in my previous post, one of the great features of ggplot is that allows you to compute summary statistics "on the fly". The bug had broken this feature for certain kinds of summary statistics computed using stat_summary(). A workaround was developed relatively quickly, which I think is a nice example of open-source software development working well, but it's great to have it fixed in the packaged version.
For me, the much bigger change occurred in the update of the ggplot2 package to version 0.9.3.1, which actually happened about a month ago, but I somehow missed it. This update is a big deal for me because it fixes a very unfortunate bug from version 0.9.3 that broke one of my favorite features: stat_summary(). As I mentioned in my previous post, one of the great features of ggplot is that allows you to compute summary statistics "on the fly". The bug had broken this feature for certain kinds of summary statistics computed using stat_summary(). A workaround was developed relatively quickly, which I think is a nice example of open-source software development working well, but it's great to have it fixed in the packaged version.
Saturday, March 2, 2013
Why I use ggplot
(via Flowing Data)
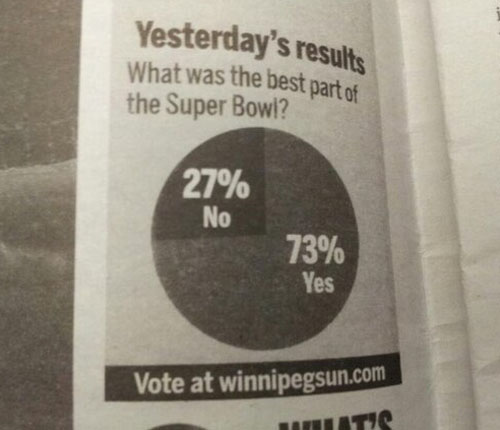
For the last few years I have been using the ggplot2 package to make all of my figures. I had used Matlab previously and ggplot takes some getting used to, so this was not an easy switch for me. Joe Fruehwald's Penn R work group was a huge help (and more recently, he posted this excellent tutorial). Now that I've got the hang of it, there are two features of ggplot that I absolutely can't live without.
Friday, February 8, 2013
Using R to get h5-index for a list of journals
In my last blog post I wrote about impact factors and h-index for different journals. That got me wondering about what the h5 index is for all of the journals that I read and may want to publish in. I could look them all up individually, but that sounds boring and monotonous. I'd much rather figure out how to get R to do it for me. I've never done this kind of thing with R before, so it took a little while, but I wrote a simple function that takes a journal name and returns its h5-index.
Subscribe to:
Posts (Atom)